OpenLM: Microservices Reporting Platform
As Head of Technology Transformation, I led OpenLM’s shift from a legacy, monolithic reporting system to a modern, event-driven microservices platform — scaling engineering, embedding analytics, and enabling SaaS expansion globally.
My Contributions
At OpenLM, I was responsible for transforming the company’s reporting backbone and positioning it for enterprise SaaS growth. My key contributions spanned architecture, engineering leadership, analytics, and business impact:
- Platform Modernization: Re-architected a batch-driven monolith into a microservices platform with Kafka, Spark, MongoDB, Postgres, and S3/MinIO, enabling real-time analytics and multi-tenancy.
- Engineering Leadership: Grew Indian operations from 3 to 85 engineers across 4 squads. Embedded CI/CD, IaC, and observability as cultural practices. Achieved 70% infra cost reduction and 30% cloud savings.
- Analytics Transformation: Delivered BI through Power BI, Superset, and embedded QuickSight portals with secure, branded, role-based access. Built self-service analytics for compliance, usage, denials, and cost optimization.
- Product & Customer Impact: Enabled customers to cut reporting latency from hours to minutes, achieve 10× ingestion throughput, and reduce duplicative infra costs through a true multi-tenant model.
- Strategic Value: Positioned OpenLM as a SaaS-ready SAM provider, opening pathways into contract management, ServiceNow/Monday integrations, and broader software asset optimization.
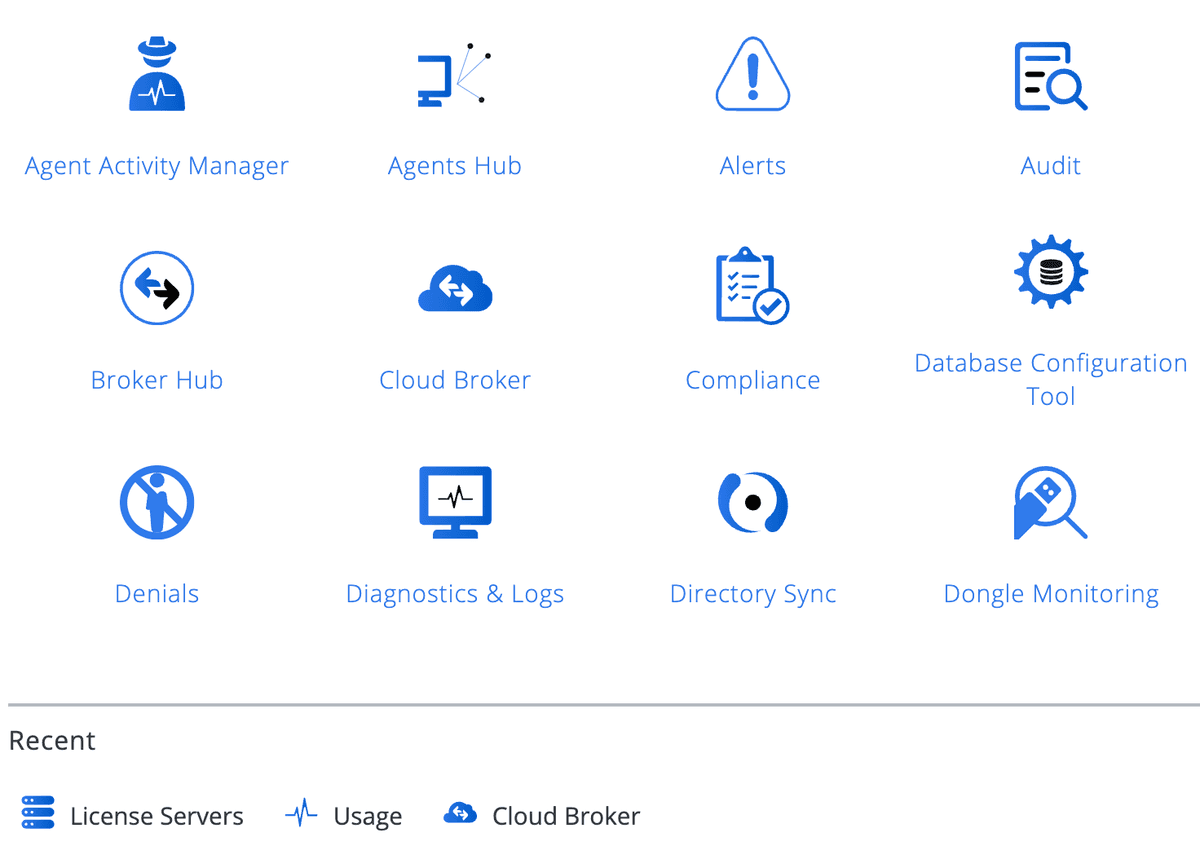
Product Dashboards
Feature hubs and admin views that power OpenLM’s daily operations.


Architecture Overview
Agents & Brokers stream data into Kafka; microservices and enrichment persist to MongoDB/Postgres; Spark ETL prepares datasets for reporting and S3/Athena. BI is served via Superset, Power BI, and embedded QuickSight.

BI Reporting
Executives, compliance managers, and operations teams access actionable insights through dashboards covering cost, usage, denials, compliance, and project performance.


